Each large year is the 990Search report edition. The smaller FY label is the underlying IRS fiscal year, two years earlier. This verified example uses nationwide CEO / Executive Director observations in the standard annual-expense ranges above $250,000.
CEO/EXECUTIVE DIRECTOR
Standard annual-expense budget ranges — $250,000 and above
+20.0%
Source: Public IRS Forms 990 and 990-EZ compensation filings. Exact annual averages are observation-weighted; hover or focus a point to see its exact average and observation count. Edition years 2020–2026 represent IRS fiscal years 2018–2024.
About this example: The historical chart uses verified published editions through 2026. The detailed nationwide and regional tables below remain the fixed 2024 sample, based on IRS fiscal year 2022 filings.
Selected comparison criteria
What this sample compares
2024 Compensation Report · Based on IRS fiscal year 2022 filings. The report edition is the publication year; the source period is the fiscal year reported to the IRS.
Organization scopePrivate foundations excluded
Charity categoryAll categories
Budget measureAnnual expenses
Minimum compensation$15,000
This is one fixed, verified sample slice. An authorized report uses the report edition and peer criteria selected by the customer.
Compensation results
Five geographic views. Forty-five peer benchmarks.
Compare the same CEO / Executive Director role across Nationwide, Northeast, Midwest, South, and West results. Every geography includes all nine standard annual-expense budget ranges. All five geographic sections are open by default; collapse any section to shorten the page.
Nationwide resultsNationwide CEO / Executive Director compensation9 budget ranges
2024 Compensation Report · Based on IRS fiscal year 2022 filings. Source: public IRS Forms 990 and 990-EZ compensation filings.
Nationwide comparison areaAll eligible U.S. filing organizations under the selected peer criteria.
2024 nationwide CEO/Executive Director benchmark · IRS fiscal year 2022
Annual-expense budget
Reported positions
Average
10th
25th
Median
75th
90th
$250,000 or less
18,241
$48,715
$20,529
$29,375
$43,514
$61,245
$81,482
$250,001–$500,000
16,434
$74,747
$33,438
$49,861
$67,511
$90,000
$120,373
$500,001–$1,000,000
17,957
$96,623
$46,394
$64,420
$85,351
$115,723
$156,453
$1,000,001–$2,500,000
22,089
$130,610
$63,293
$84,001
$111,757
$155,417
$216,275
$2,500,001–$5,000,000
12,983
$175,342
$84,601
$109,703
$146,907
$204,448
$291,153
$5,000,001–$10,000,000
9,725
$222,212
$104,236
$136,418
$185,182
$259,498
$367,904
$10,000,001–$25,000,000
8,420
$289,094
$130,671
$171,491
$236,121
$336,564
$484,948
$25,000,001–$50,000,000
3,803
$405,963
$167,952
$223,294
$311,591
$448,804
$666,239
Greater than $50,000,000
4,156
$809,108
$233,901
$338,464
$503,253
$843,207
$1,497,081
“Reported positions” means eligible person/filing/role observations included under the published methodology. The $250,000-or-less row is the standard combined range.
Northeast resultsNortheast CEO / Executive Director compensation9 budget ranges
2024 Compensation Report · Based on IRS fiscal year 2022 filings. Source: public IRS Forms 990 and 990-EZ compensation filings.
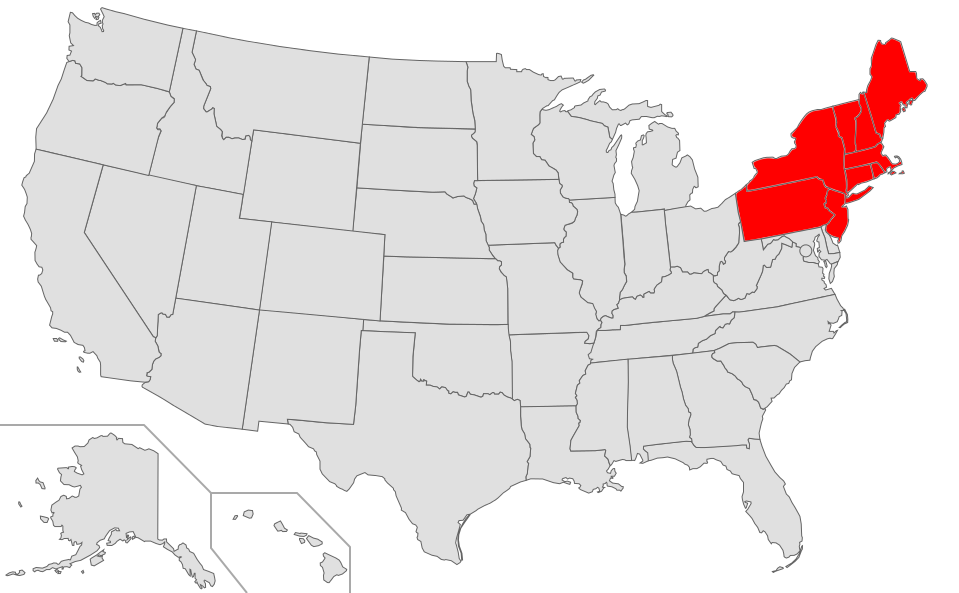
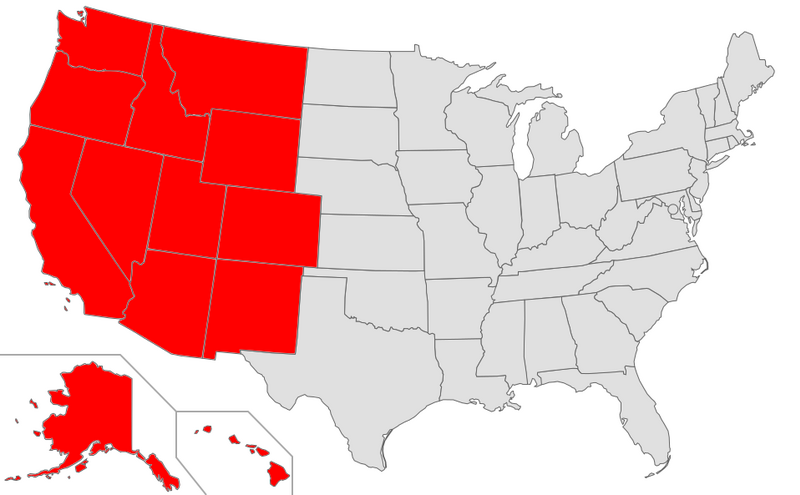
Northeast comparison areaOrganizations located in the highlighted U.S. Census region under the same peer criteria.
2024 northeast CEO/Executive Director benchmark · IRS fiscal year 2022
Annual-expense budget
Reported positions
Average
10th
25th
Median
75th
90th
$250,000 or less
3,221
$49,593
$20,800
$29,466
$44,004
$62,500
$82,500
$250,001–$500,000
2,996
$75,869
$35,141
$51,500
$69,928
$90,273
$120,000
$500,001–$1,000,000
3,553
$101,147
$49,599
$67,126
$89,328
$120,768
$164,052
$1,000,001–$2,500,000
4,593
$135,824
$66,982
$89,390
$117,178
$159,962
$222,699
$2,500,001–$5,000,000
2,811
$188,408
$93,892
$120,297
$158,861
$218,234
$301,000
$5,000,001–$10,000,000
2,253
$228,125
$111,902
$145,834
$193,392
$268,508
$357,968
$10,000,001–$25,000,000
2,016
$302,071
$139,944
$178,845
$245,139
$344,198
$488,416
$25,000,001–$50,000,000
937
$403,504
$172,613
$228,047
$307,447
$450,015
$659,145
Greater than $50,000,000
1,090
$837,106
$236,437
$348,564
$524,341
$894,145
$1,449,367
Midwest resultsMidwest CEO / Executive Director compensation9 budget ranges
2024 Compensation Report · Based on IRS fiscal year 2022 filings. Source: public IRS Forms 990 and 990-EZ compensation filings.
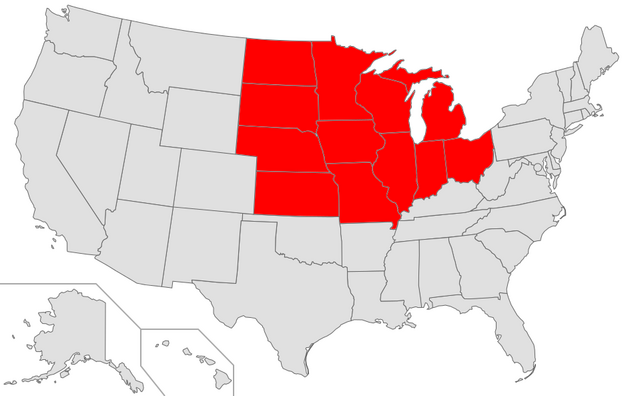
Midwest comparison areaOrganizations located in the highlighted U.S. Census region under the same peer criteria.
2024 midwest CEO/Executive Director benchmark · IRS fiscal year 2022
Annual-expense budget
Reported positions
Average
10th
25th
Median
75th
90th
$250,000 or less
4,418
$47,206
$20,554
$29,453
$43,024
$59,933
$77,858
$250,001–$500,000
3,782
$71,254
$32,359
$48,479
$65,240
$85,315
$113,453
$500,001–$1,000,000
4,010
$90,216
$45,538
$62,291
$81,478
$107,986
$144,209
$1,000,001–$2,500,000
4,808
$121,736
$61,774
$80,414
$104,841
$142,549
$197,531
$2,500,001–$5,000,000
2,761
$161,265
$81,845
$103,752
$134,300
$186,372
$268,824
$5,000,001–$10,000,000
2,083
$202,116
$97,086
$127,376
$170,700
$236,011
$340,822
$10,000,001–$25,000,000
1,874
$257,966
$125,105
$160,228
$219,838
$304,308
$429,670
$25,000,001–$50,000,000
783
$361,249
$170,141
$225,995
$301,403
$416,373
$577,388
Greater than $50,000,000
856
$793,778
$234,561
$350,409
$518,065
$833,268
$1,499,625
South resultsSouth CEO / Executive Director compensation9 budget ranges
2024 Compensation Report · Based on IRS fiscal year 2022 filings. Source: public IRS Forms 990 and 990-EZ compensation filings.
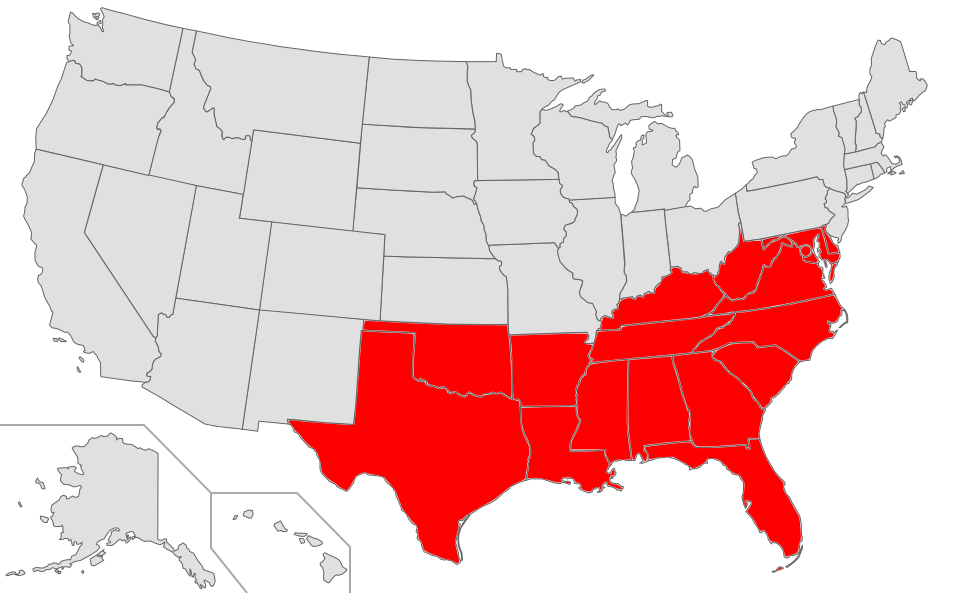
South comparison areaOrganizations located in the highlighted U.S. Census region under the same peer criteria.
2024 south CEO/Executive Director benchmark · IRS fiscal year 2022
Annual-expense budget
Reported positions
Average
10th
25th
Median
75th
90th
$250,000 or less
6,159
$48,726
$20,251
$29,235
$43,098
$61,300
$82,467
$250,001–$500,000
5,544
$75,454
$32,505
$48,297
$66,407
$90,646
$124,060
$500,001–$1,000,000
5,822
$97,817
$45,455
$62,957
$84,922
$117,047
$160,000
$1,000,001–$2,500,000
7,003
$135,031
$60,840
$82,238
$111,136
$162,927
$234,799
$2,500,001–$5,000,000
4,088
$183,127
$81,503
$108,222
$148,028
$217,914
$319,686
$5,000,001–$10,000,000
3,016
$241,318
$102,615
$137,937
$192,207
$281,082
$420,287
$10,000,001–$25,000,000
2,578
$312,359
$126,813
$171,664
$244,335
$358,666
$553,690
$25,000,001–$50,000,000
1,206
$462,959
$165,366
$218,841
$323,866
$487,892
$742,796
Greater than $50,000,000
1,326
$784,343
$228,914
$330,322
$486,020
$832,355
$1,527,785
West resultsWest CEO / Executive Director compensation9 budget ranges
2024 Compensation Report · Based on IRS fiscal year 2022 filings. Source: public IRS Forms 990 and 990-EZ compensation filings.
West comparison areaOrganizations located in the highlighted U.S. Census region under the same peer criteria.
2024 west CEO/Executive Director benchmark · IRS fiscal year 2022
Annual-expense budget
Reported positions
Average
10th
25th
Median
75th
90th
$250,000 or less
4,404
$49,635
$20,703
$29,463
$44,000
$62,400
$84,877
$250,001–$500,000
4,067
$76,428
$35,000
$51,343
$70,500
$92,988
$122,494
$500,001–$1,000,000
4,521
$97,514
$47,539
$66,562
$87,737
$117,262
$157,254
$1,000,001–$2,500,000
5,623
$128,856
$66,128
$86,755
$115,092
$153,781
$205,338
$2,500,001–$5,000,000
3,276
$166,995
$87,079
$111,223
$146,499
$194,909
$260,947
$5,000,001–$10,000,000
2,345
$210,501
$106,310
$136,719
$183,648
$244,326
$328,915
$10,000,001–$25,000,000
1,910
$276,213
$135,376
$174,859
$233,517
$324,041
$459,417
$25,000,001–$50,000,000
844
$375,058
$171,878
$222,980
$317,189
$440,552
$635,795
Greater than $50,000,000
841
$842,395
$242,666
$341,345
$502,239
$815,018
$1,562,141
How to read the table
Distribution, not a prescribed salary
The average uses every eligible value in the row. The median marks the midpoint of the sorted distribution. Percentiles describe positions within that distribution. They do not determine what an individual should be paid.
Organization scale can materially change the peer group, which is why every row identifies its annual-expense range.
Methodology summary
How the benchmark was built
01
Collect
Use eligible public IRS Forms 990 and 990-EZ compensation filings for fiscal year 2022 in the 2024 report edition.
02
Normalize
Apply versioned title rules to supported CEO and Executive Director observations.
03
Calculate
Apply peer criteria, suppression rules, and the published distribution method.
This sample contains historical compensation information reported on public IRS filings. Filing errors, reporting differences, data lag, role differences, and the selection of comparable organizations can affect the result. 990Search reports are informational research and are not legal, tax, accounting, audit, valuation, employment, or compensation advice. A report does not independently establish reasonable compensation, legal compliance, or a rebuttable presumption under Section 4958.